The Senior Software solution convinced us due to its remarkable adaptation to the Romanian legislation and to the realities of our local business environment.
Commercial Director
"Platforma inovativa pentru eficientizarea activitatii IMM-urilor din Romania"
- Competitivi impreuna - Pentru informatii detaliate despre celelalte programe
cofinantate de Uniunea Europeana, va invitam sa vizitati www.fonduri-ue.ro
Since 2003, we have been helping national and international companies reach their full potential, work more efficiently and be more profitable, by providing them with solutions customised to their needs.
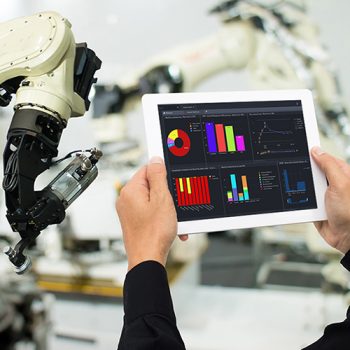
You get FREE CRM, SFA and Dashboards features when purchasing the system.
The success of our projects is due to the professionalism and know-how of the team, but also to the partnerships with world-class players, with whom we share features such as innovation and the desire to turn technology into direct benefits for companies.
Our systems are used by hundreds of companies in the country and abroad, with distribution, production, retail or service activities.
Our experience translates into best practices and customized workflows, embedded in specialized automation solutions.
Every company has unique work processes and requirements, thus it needs modern software tools to connect employees, departments and specific workflows.
We use the latest technologies from Microsoft along with internationally tested platforms.
Encourages work in shifts and reduces licensing costs up to 2 or 3 times.
Encourages work in shifts and reduces up to 2 or 3 times the licensing costs
Reduce the document-based interaction and the physical contact with carriers
Issuing and sending documents thorough integration with ERP, carriers, etc.
The Senior Software solution convinced us due to its remarkable adaptation to the Romanian legislation and to the realities of our local business environment.
The Senior Software team has supported us throughout the implementation period, from the initial analysis until the Go Live phase. We were fully operational within a week.
The ERP system allows us to see exactly what everyone is doing which enabled us to stimulate our employees’ productivity, and led to a very good control over our workforce.
We collaborated very well with the Senior Software technical team. They were prompt and quickly solved our problems and requests regarding the workflows feature.
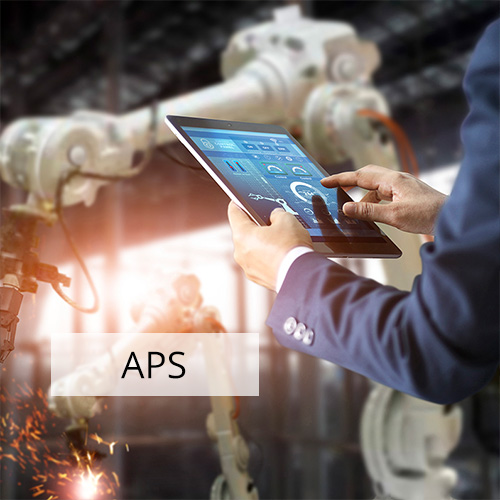
Senior Software provides audit services for companies that want to take the first step towards digitalizing the factory and Industry 5.0. The audit is meant to determine the specific needs for machine data collection from the machines. What benefits can factory digitalization bring you?
IRUM has enhanced its entire production planning and scheduling process with Senior Software’s APS system. The Romanian manufacturer can now…
Instal Impex, distributor of sanitary items, managed to gain major time savings in its business processes, lowered costs and increased sales by optimizing inventory, resource management and…
Trek Tor Sell, online retailer that sells equipment and products for zootechnics and who owns the Gospodaria 9 online store, optimized activities since it started using a modern and scalable ERP solution. With the help of SeniorERP, the distributor processes orders…

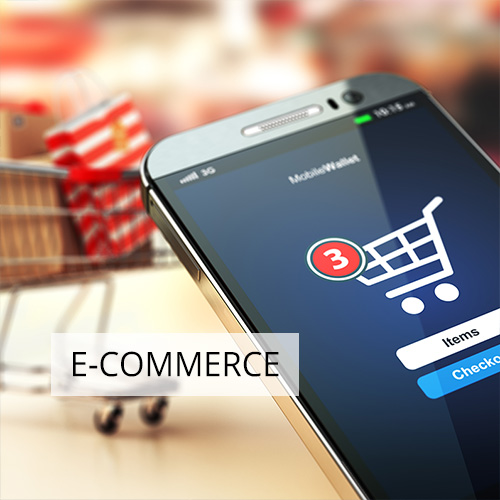
Offer your customers unique shopping experiences with Ecommerce B2C & B2B solutions. Choose a customizable e-commerce platform, perfectly integrated with your ERP system.
B2C — customizable online store with a modern design that offers you unlimited possibilities to promote your product portfolio.
B2B — the fastest way for Manufacturers or Distributors on the one hand, and Resellers or Clients on the other to interact and sell/purchase.
TeraSteel manages its 3 factories from Romania and Serbia with the APS suite for production planning. After implementing, the company increased production by…